

Overview of widget types
See the various details of each widget type.
Unlike sinks, widgets can be visualized in FLOW Insights' dashboard. See the [dedicated article][widgets] on how to use them and details about their types.
Operator attributes and widget types
There are many forms of information you can get about traffic data passing through a certain operator. You may want statistical data about speed or acceleration of all passing traffic, or maybe a speed heatmap. From the standpoint of the server’s HTTP response, the widget’s type denotes the contents of each widget’s data object – the names and data types of its member variables. It also denotes additional parameters that may be a part of widget output requests. The attribute that the widget is attached to decides the values of these members. The following table shows a list of all attributes that all operators have along with their associated widget type.
| Filter attribute | Widget type |
|---|---|
| Object count | Value |
| Occupancy | Value |
| Duration of occurrence | Statistical value |
| Current speed | Statistical value |
| Section speed | Statistical value |
| Stationary duration | Statistical value |
| Acceleration | Statistical value |
| Gap distance | Statistical value |
| Gap time | Statistical value |
| Trajectory list | Table |
| Trajectory view | Trajectory view |
| Category distribution | Distribution |
| Color distribution | Distribution |
| Speed map | Heatmap |
| Acceleration map | Heatmap |
| Occupancy map | Heatmap |
| Object count | OD matrix |
| Traffic lanes events | Traffic lanes events data |
| Trajectory events | Events |
| Near miss events | Events |
| Traffic light | Traffic light |
Light vs. heavy data
Outputs are categorized as light data or heavy data outputs. This reflects how large their data responses tend to be in general. To prevent output data responses from growing out of proportion, it's only possible to request data from one heavy data output at a time. In other words, when requesting for a heavy data widget output, no other light data or heavy data widget output can be requested in the same request.
Details of widget types
In this section, you'll find detailed descriptions of each widget type. The properties data_validity, evaluation_validity, object_count, and last_reset_time are common for all widget types. They're all explained in the [previous article][using_ws].
Processing state
This widget, together with the Visibility state widget, is one of the default widgets created automatically together with an analytic. It can't be changed or removed and is hidden in FLOW Insights by default.
JSON type identifier: processing_state
History supported: Yes
Output heaviness: Light data
Additional request parameters: None
Response's data object contents: A single string value denoting the analytic's processing state, i.e. whether it's evaluating data
Example of response's data contents:
"data": {
  "data_validity": "ok",
  "evaluation_validity": "ok",
  "last_reset_time": "1745846018680",
  "object_count": 0,
  "string_value": "processing"
}
Possible values are: idle and processing.
Visibility state
This widget, together with the Processing state widget, is one of the default widgets created automatically together with an analytic. It can't be changed or removed and is hidden in FLOW Insights by default. If the analytic doesn't have visibility detection set up, the value of this widget will always be unknown.
JSON type identifier: visibility_state
History supported: Yes
Output heaviness: Light data
Additional request parameters: None
Response's data object contents: A single string value denoting the analytic's visibility state
Example of response's data contents:
"data": {
  "data_validity": "ok",
  "evaluation_validity": "ok",
  "last_reset_time": "1745852131880",
  "object_count": 0,
  "string_value": "good"
}
Possible values are: good, poor, and unknown.
Value
JSON type identifier: value
History supported: Yes
Output heaviness: Light data
Additional request parameters: None
Response's data object contents: A single numerical value
Example of response's data contents:
"data": {
  "data_validity": "ok",
  "evaluation_validity":"ok",
  "object_count": 57,
  "value": 57
}
Statistical value
JSON type identifier: statistical_value
History supported: Yes
Output heaviness: Light data
Additional request parameters: None
Response's data object contents: A collection of key/value pairs. The values are always a single number. The keys designate: Minimum value, maximum value, median, average, mode, variance, and size (number of samples). size is currently redundant and has the same value as object_count.
Example of response's data contents:
"data": {
  "data_validity": "ok",
  "evaluation_validity":"ok",
  "object_count": 624,
  "minimum": 0.0,
  "maximum": 51.6,
  "median":  41.1,
  "average": 40.2,
  "size": 624
}
Table
Tables are currently limited to hold up to 10,000 records of closed trajectories. There's no limit for additional open trajectories. Sending all of them at once can be demanding on the hardware and bandwidth. That's why each response will hold a maximum of 100 table records. In order to obtain further rows, you need to include further parameters in your data request. By default, tables are ordered by the "Trajectory start" column in ascending order.
JSON type identifier: table
History supported: No
Output heaviness: Heavy data
Additional request parameters:
number_of_rows—maximum number of rows you want to receive in one page. The actual received number can be lower if there are not enough rows in the table, or if you provided a number greater than 100.first_row_index—the row index at which the returned page shall startorder_by—the name of column by which you want the page to be ordered. You can see column names in the response example below in theheaderarray. The table is ordered before a page is extracted.order—eitherascending, ordescending
(All of these parameters are optional.)
Example request body:
{
  "sequence_number": "11",
  "widgets": [
    {
      "id": 0,
      "number_of_rows": 100,
      "first_row_index": 200,
      "order_by": "Maximum speed",
      "order": "descending"
    }
  ]
}
Response's data object contents:
table_size—total number of rows in the table; currently redundant and synonymous withobject_countnumber_of_rows—number of rows in the current pageheader—an array of strings designating the names of table columns. You can read more about the Gap time, Gap distance, and Section speed colums in a dedicated article.units—the measurement units used in each column.kpxare kilopixels. Positions and sizes are in normalized screen coordinates—values from 0.0 to 1.0 where 0.0 is in the upper left corner of the image.formats—the preferred formats in which to display data in each column to the user. Thefloattype also states the number of decimal places. Thedatetimetype specifies a format according to Qt's format strings for date and time. This property is for the needs of FLOW Insights and can be ignored by other clients.data_start—the value of the column of the first row in the returned page, always as a string. If the table is ordered by "Trajectory start", then this property is instead nameddata_start_time.data_end—the value of the column of the last row in the returned page, always as a string. If the table is ordered by "Trajectory start", then this property is instead nameddata_end_time.order—eitherascending, ordescendingdata—an array of arrays, each containing one table row
See the Trajectory view widget for a list of possible values in the Category column.
Example of response's data contents:
"data": {
  "data_validity": "ok",
  "evaluation_validity": "ok",
  "object_count": 16,
  "data_end_time": "1618991959204",
  "data_start_time": "1618990159105",
  "first_row_index": 0,
  "number_of_rows": 16,
  "order": "ascending",
  "table_size": 16,
  "header": [ "ID", "License plate", "Category", "Color",
              "Trajectory start", "Trajectory end", "Average speed",
              "Minimum speed", "Maximum speed", "Section speed",
          	  "Average acceleration", "Gap time", "Gap distance",
              "Duration of occurrence", "Stationary duration",
          	  "Last position X", "Last position Y",
              "Last bounding box X", "Last bounding box Y",
              "Last bounding box width", "Last bounding box height" ],
  "units": [ "", "", "", "", "ms", "ms", "kpx/h", "kpx/h",
            "kpx/h", "km/h", "px/s²", "s", "px", "s", "s",
            "", "", "", "", "", "" ],
  "formats": [ "int", "string", "string", "string",
              "datetime;yyyy-MM-dd hh:mm:ss",
              "datetime;yyyy-MM-dd hh:mm:ss",
              "float;0", "float;0", "float;0", "float;0",
              "float;1", "float;2", "float;0", "float;2",
              "float;2", "float;6", "float;6", "float;6",
              "float;6", "float;6", "float;6" ],
  "data": [
    [ "5", "Undefined", "pedestrian", "undefined", "1618990434162",
      "1618990442603", "162.32", "13.31", "719.34", "-", "0.97",
      "-", "-", "54.59", "31.40", "0.984672", "0.768475",
      "0.984672", "0.768475", "0.014019", "0.069893" ],
    [ "8", "Undefined", "car", "white", "1685370299216",
      "1685370338389", "173.54", "26.60", "581.06", "-", "1.55",
      "-", "-", "39.17", "18.48", "0.133255", "0.104881",
      "0.134138", "0.103832", "0.055505", "0.073010" ],
    // ...
  ]
}
Distribution
JSON type identifier: distribution
History supported: Yes
Output heaviness: Light data
Additional request parameters: None
Response's data object contents: A collection of key/value pairs, where keys are histogram categories (classes), and values are single numerical values. The possible categories depend on FLOW node's current configuration. You can find them out with the Camera information request.
Example of response's data contents for a category distribution :
"data": {
   "data_validity": "ok",
   "evaluation_validity":"ok",
   "object_count": 130,
   "categories": [
      {
         "category": "bicycle",
         "count": 13
      },
      {
         "category": "bus",
         "count": 3
      },
      {
         "category": "car",
         "count": 74
      },
      {
         "category": "light",
         "count": 11
      },
      {
         "category": "pedestrian",
         "count": 29
      },
      {
         "category": "unknown",
         "count": 0
      }
   ]
}
Example of response’s data contents for a color distribution:
"data": {
   "data_validity": "ok",
   "evaluation_validity":"ok",
   "object_count": 14,
   "colors": [
      {
         "color": "black",
         "count": 4
      },
      {
         "color": "blue",
         "count": 0
      },
      {
         "color": "brown",
         "count": 0
      },
      {
         "color": "red",
         "count": 1
      },
      {
         "color": "silver",
         "count": 2
      },
      {
         "color": "undefined",
         "count": 7
      }
   ]
}
Trajectory view
JSON type identifier: trajectory_view
History supported: No
Output heaviness: Heavy data
Additional request parameters: None
Response's data object contents:
data_type—will always have the valuebitwise_render, denoting the format of thedataproperty (see below)categories—a list showing which FLOW category is associated with each bit of a pixel of the image in thedatapropertydata—a string containing a Base64 representation of a PNG image. The image has four channels (RGBA) where each bit of the RGB channels corresponds to a FLOW category, denoting whether the category is present in the particular pixel. Category order is given in thecategoryproperty: The first category corresponds to the first (least significant) bit of the R channel, eighth category corresponds to the eighth bit of the R channel, ninth category corresponds to the first bit of the G channel, 17ᵗʰ category corresponds to the first bit of the B channel etc.- E.g. in the example output below, the
caravancategory corresponds to the fourth bit of the B channel, because it's the 12ᵗʰ category and the fourth bit of the B channel is the 12ᵗʰ bit in the three RGB bytes.
- E.g. in the example output below, the
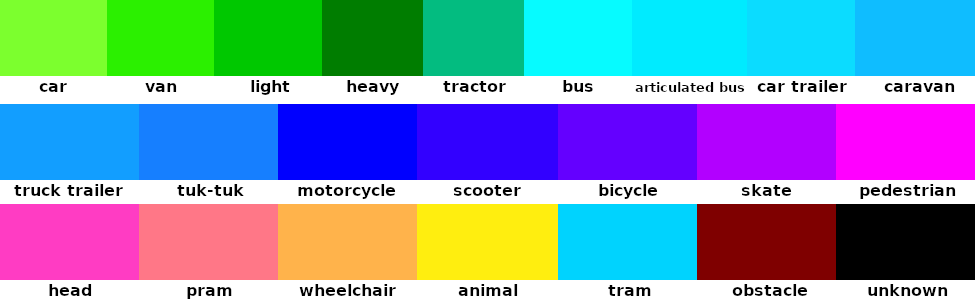
Below's a list of possible categories together with the color in which they are rendered in FLOW Insights. This list may change in the future.
car—#7CFF2Evan—#2BF000light(Light truck)—#00C800heavy(Heavy truck)—#007D00tractor—#04BC80bus—#07FBFFarticulated bus—#00EBFFcar trailer—#0BDCFFcaravan—#0FBDFFtruck trailer—#129EFFtuk-tuk—#167FFFmotorcycle—#0000FFscooter—#3200FFbicycle—#6400FFskate—#B200FFpedestrian—#FF00FFhead—#FF3CC3pram—#FF7787wheelchair—#FFB34Banimal—#FFEE0Ftram—#00D3FEobstacle—#7F0000unknown—#000000
Example of response's data contents:
"data": {
    "object_count": 466,
    "timestamp": "1746446579600"
    "evaluation_validity": "ok",
    "data_validity": "ok",
    "data_type": "bitwise_render",
    "categories": [
        "unknown", "car", "light", "heavy", "bus", "motorcycle", "bicycle", "pedestrian",
        "articulated bus", "van", "animal", "caravan", "pram", "car trailer", "head", "scooter",
        "skate", "tractor", "truck trailer", "tuk-tuk", "wheelchair", "tram", "obstacle" ],
    "data": "iVBORw0KGgoAAAANSUhEUgAABQAA", // ...
}
Example of decoded trajectory view data rendered over a video snapshot using the above color scheme:

Heatmap
JSON type identifier: heatmap
History supported: No
Output heaviness: Heavy data
Additional request parameters: None
Response's data object contents: A map_type property, which can have either the Heatmap, or Gridmap value. This section will concern the Heatmap type—Gridmap will be described in the next one. The response also contains two matrices: sum_data and count_data. A quick guide to parse the matrix data:
- Decode the string from Base64.
- Unzip with the ZLIB library's flate algorithm.
- Parse the first four 32-bit integers representing the number of rows, number of columns, OpenCV element type (always 32-bit float), and number of channels (always 1) respectively.
- Parse the 1D array of 32-bit floats representing the matrix data.
The matrices are represented as a raw 1D array of 32-bit floats, but the matrices are of the same total size as the video image (i.e. the array's size is image_height*image_width). Each element is a value that relates to the corresponding pixel in the original image—elements of the sum_data matrix represent a sum of a value selected during the widget's creation (e. g. current speed) and elements of the count_data matrix represent the number of samples.
For example for an image with resolution 1920x1080 and Speed map type of heatmap, the second element of sum_data would contain a sum of speeds of all trajectories that crossed the second pixel in the first row, and the second element of the count_data matrix would contain the number of those trajectories. Therefore by dividing the sum value by the count value, you can obtain the average value for the corresponding pixel in the input image.
For another example, if the image has a resolution of 1920x1080 px, then the matrices would be represented as 1D arrays containing 1920*1080 = 2073600 elements. Element 68372 of the array would correspond to the image pixel in a row floor(68372/1920) = 35 and column 68372%1920 = 1172 where % represents the modulus operation.
The matrices are quite large, so each of them is compressed with the ZIP (deflate) algorithm of the ZLIB library and encoded in Base64 before being placed into JSON response and sent.
Example of response’s data contents:
"data": {
  "object_count": 420,
  "data_validity": "ok",
  "evaluation_validity":"ok",
  "map_type": "Heatmap",
  "count_data": "TWFuIGlzIGRpc3RpbmXNoZWQsIG5vdCB5IGhpcyByZWF", // ...
  "sum_data": "WQsIG5vdCBvbmx5IGJ5IGhpcyByZWd1aXNoZWQsIG55as", // ...
  "timestamp": "1685008212409"
}
Example of a heatmap converted to a grayscale image:

For illustration purposes, here is an example of a processed (colored) heatmap overlaid over a corresponding video snapshot:

Comments:
timestamphas the same meaning and value as the widget'stimestampvalue outside of thedataobject, which is described in Getting the list of all widgets
Gridmap
Technically, gridmap is a subtype of the heatmap, but its output is a bit different, so it'll be explained here in a separate section. See the explanation of a [gridmap widget][widgets] to learn what it is. It's the same with a gridmap widget.
JSON type identifier: heatmap
History supported: No
Output heaviness: Heavy data
Additional request parameters: None
Response's data object contents: A map_type property, which can have either the Heatmap, or Gridmap value. This section will concern the Gridmap type—Heatmap is described in the previous one. Then there is tile_size, which denotes how many pixels are aggregated in one grid tile in each dimension. For example, a tile_size of 50 means that each grid aggregates 50x50=2500 pixels. Moreover, for an image of size 1920x1080, the grid has ceil(1920/50)=39 columns and ceil(1080/50)=22 rows. (ceil() is an operation of rounding up to the nearest integer.) Finally, the response's data object contains another data property, which contains a JSON string with the encoded grid. A quick guide to decode it:
- Decode the string from Base64.
- Unzip with the ZLIB library's flate algorithm.
- Parse the array of 32-bit floats representing the matrix data.
Tiles are stored in a row-major order. Each tile comprises of 5 32-bit floats: Minimum, maximum, average, median, and object count. These statistical values are tied to the operator attribute that's been set for the widget: speed, acceleration, object count etc.
Example of response’s data contents:
"data": {
  "object_count": 420,
  "data_validity": "ok",
  "evaluation_validity": "ok",
  "map_type": "Gridmap",
  "source_height": 1520,
  "source_width": 2704,
  "tile_size": 50,
  "data": "eJzsnHlQFVcWhzsKQUFxQ1xxgR" // ...
}
Example of a gridmap displayed as a widget in FLOW Insights:

OD matrix
OD matrix functionality is explained in a [dedicated how-to article][od_matrix].
JSON type identifier: od_matrix
History supported: Yes (in all time modes), the number of records is limited to 1000
Output heaviness: Light data
Additional request parameters: None
Response's data object contents:
origins—an array of entry gates (user name and ID)destinations—an array of exit gates (user name and ID)turning_movements—rows of turning counts
The data have a row-oriented format where the rows represent entry/origin gates. The columns are exit/destination gates. The order of the elements in the headers (origins/destinations) corresponds to the order of the data in the turning_movements section. Maximum size is 8x8.
Example of response’s data contents:
(the size of the OD matrix is 1x2 i.e. 1 entry and 2 exits)
"data": {
    "data_validity": "ok",
    "evaluation_validity": "ok",
    "object_count": 604,
    "origins": [             // OD origins/entries
        {
           "id": 1,          // id of the entry gate
           "name": "In"      // name of the entry gate
        }
    ],
    "destinations": [         // OD destinations/exits
        {
            "id": 3,          // id of the exit gate (generated by FLOW)
            "name": "Out 1"   // name of the gate (defined by user)
        },
        {
            "id": 4,
            "name": "Out 2"
        }
    ],
    "turning_movements": [   // data is entry/row-oriented
         {
             "category": "car",
             "data": [
                 [ 0, 5025]  // In -> Out 1: 0; In -> Out 2: 5025
             ]
         },
         {
             "category": "pedestrian",
             "data": [
                 [ 0, 19]  // In -> Out 1: 0; In -> Out 2: 19
             ]
         },
         // ...the rest of all supported categories
      ]
   ]
}
Traffic lanes events data
This widget is intended to be used together with the Multi traffic lane operator and is a work in progress. It'll be documented if future FLOW versions.
Events
This widget stores events (e.g. cars passing through a zone) into a database. This ensures that data is persistent and therefore not lost when FLOW stops running. What constitutes an event depends on the attribute to which the widget is tied to. There are currently two possible attributes:
- Trajectory events—the presence of any trajectory that passed the filter to which the Events widget is attached
- Near miss events—an event outputted by the Near miss operator. This attribute can't be used with other types of operators.
JSON type identifier: events
History supported: Yes
Output heaviness: Light data
Additional request parameters:
event_types—an optional filter—the returned events must match at least one of the types in this array of strings. If this filter is present and no records match it, the response'seventskey will be missing. Possible values can be any combination of:Completed—include every closed eventCreated—include open events whosedata_flagis created (brand-new this evaluation)Updated—include open events whosedata_flagis updated
Example request body:
{
  "sequence_number": "36",
  "widgets": [
    { "id": 5, "event_types": ["Created", "Completed"] }
  ]
}
Response's data object contents:
The Events widget's output is very similar to that of the table widget. This section will only mention properties that differ from it.
object_count—total number of rows in the tabledata_types—same as table widget'sformatspropertyevents—an array of event objects, each representing one event, i.e. table row. If theevent_typesfilter is present in the request and no records match it, this key will be missing.id—event ID, distinct from the ID of the associated trajectoriesclosed—denotes whether the event has been closed, i.e. whether any of its attributes can still be subject to change. Note: The event (e.g. trajectory occurrence in a zone) can be closed even if the associated trajectories haven't yet been closed (e.g. because the trajectory hasn't yet left the scene).data_flagcan have two values:created—this is the first instance of the eventupdated—some properties of this event have changed since its creation
start_timestampandend_timestamp—show when the event happeneddatais the table row itself
See the Trajectory view widget for a list of possible values in the Category column.
Note: The contents of the header, units, and data_types arrays may be different based on the attribute to which the widget is tied to or in future versions of FLOW.
When requesting data from the /cubes/{cube_id}/analytics/{analytic_id}/widgets/data endpoint, FLOW returns only events that are currently active. Active events are events that are open (haven't been closed) or whose associated trajectories are still [open][time]. When the event and associated trajectories close, the event will stop showing up in the output. For a complete list of events including the closed ones, use the /cubes/{cube_id}/analytics/{analytic_id}/widgets/history endpoint.
Example of response's data contents:
"data": {
    "data_validity": "ok",
    "evaluation_validity": "ok",
    "object_count": 3,
    "header": [ "ID", "License plate", "Category", "Color",
                "Trajectory start", "Trajectory end", "Average speed",
                "Minimum speed", "Maximum speed", "Section speed",
                "Average acceleration", "Gap time", "Gap distance",
                "Duration of occurrence", "Stationary duration",
                "Last position longitude", "Last position latitude",
                "Last bounding box X", "Last bounding box Y",
                "Last bounding box width", "Last bounding box height",
                "Trajectory score", "Last detection score"
    ],
    "data_types": [ "int", "string", "string", "string",
                    "datetime;yyyy-MM-dd hh:mm:ss",
                    "datetime;yyyy-MM-dd hh:mm:ss",
                    "float;0", "float;0", "float;0", "float;0", "float;1",
                    "float;2", "float;0", "float;2", "float;2", "float;6",
                    "float;6", "float;6", "float;6", "float;6", "float;6",
                    "float;2", "float;2" ],
    "units": [ "", "", "", "", "ms", "ms", "km/h", "km/h", "km/h", "km/h",
               "m/s²", "s", "m", "s", "s", "deg", "deg", "", "", "", "",
               "", "" ],
    "events": [
        {
            "id": 190,
            "closed": true,
            "data_flag": "updated",
            "start_timestamp": "1746184996640",
            "end_timestamp": "1746184997680",
            "data": [
                13161, "-", "car", "silver", 1746184996640, 1746184997680,
                56.22542825845572, 41.128174209594725, 69.71476821899414,
                17.307693099975587, -8.849380002571987, null, null, 1.04,
                0, 16.59510245389888, 49.223667291165015, 0.6104006171226501,
                0.2974833846092224, 0.1137838363647461, 0.09728121757507324,
                0.7341134548187256, 0.6794726848602295
            ]
        },
        {
            "id": 192,
            "closed": true,
            "data_flag": "updated",
            "start_timestamp": "1746185029240",
            "end_timestamp": "1746185030200",
            "data": [
                13372, "-", "car", "silver", 1746185029240, 1746185030200,
                61.88123359680176, 50.04858169555664, 72.34058303833008,
                18.75000057220459, -7.646434028943379, null, null, 0.96,
                0, 16.595116029154436, 49.22367353055333, 0.6353302001953125,
                0.2823629379272461, 0.10351240634918213, 0.08106133341789246,
                0.7291982173919678, 0.641086995601654
            ]
        },
        {
            "id": 193,
            "closed": true,
            "data_flag": "updated",
            "start_timestamp": "1746185033640",
            "end_timestamp": "1746185034320",
            "data": [
                13408, "-", "car", "white", 1746185033640, 1746185034320,
                89.41202928879682, 74.38637466430664, 100.3481803894043,
                26.470587730407715, -9.828578668482164, null, null, 0.68,
                0, 16.595101121744452, 49.22366283508705, 0.6011162400245667,
                0.29313865303993225, 0.13294833898544312, 0.11084452271461487,
                0.7825250029563904, 0.7761294841766357
            ]
        }
    ]
},
Getting the history of Event widgets
Compared to getting the history of other widget types, event widgets offer additional options for filtering the returned events. The following filtering options are available:
- By start and end timestamps—same as for all other widgets
- By offset and count
offset—non-negative integer, optional. The starting record number from whichcountrecords will be retrieved. Records are ordered by event ID as ascending. Offset is not event ID, as some events may have been deleted etc. You can find the current number of records by inspecting thehistory_records_countproperty of the/cubes/{cube_id}/analytics/{analytic_id}/widgetsor/cubes/{cube_id}/analytics/{analytic_id}/widgets/historyendpoint responses. Default value is 0.count—integer, optional, the number of records to be retrieved, starting atoffset. Values less or equal to 0 are treated as "maximum allowed number of records", which is 100, but may change in the future. This is also the default value.
- By event ID interval—event IDs here are represented by numbers inside strings to allow for larger values than JSON supports for pure integers. Events are ordered ascending. Note that retrieved event IDs may not be continuous as some events may have been deleted.
event_id_start—starting event ID, inclusive. Optional. The default value is"0".event_id_end—end of the event ID interval, inclusive. Optional. The default value is the maximum supported ID.
To use a filtering option, include any of its associated properties in the event widget history request. Combining multiple filtering options is not allowed. E.g. you can use event_id_start and event_id_end properties, but then adding offset will result in failure. Example request:
{
    "sequence_number": "36",
    "widgets": [
        {
            "id": 7,
            "offset": 555,
            "count": 50
        },
      	{
            "id": 8,
            "event_id_start": "100",
            "event_id_end": "150"
        },
      	{
            "id": 9,
            "offset": 1234
        },
        {
            "id": 10,
            "event_id_start": "5678"
        },
    ]
}
Movement set statistics
This fairly complicated widget allows the user to get holistic data about how traffic objects pass an intersection. It's described in detail in a dedicated article . This section presumes knowledge of the article.
JSON type identifier: movement_set_statistics
History supported: Yes
Output heaviness: Light data
Additional request parameters: None
Response's data object contents:
This section will explain only the parts of the data response that are not obvious. For a complete list, refer to the example below.
granularity—the data aggregation time interval. The data's aggregated at the end of this interval, aligned to whole hours. There's up to 10 second delay after an interval ends before its data is made available on the REST API.movements—contents of this object describe the layout of the widget and movements that act as its data sourcecartogram_position—a list of cartogram arm indexes that the movement connectscolor—the color of the arm for visualisation purposes, e.g. in FLOW Insights, in hexadecimal RGB notation with a leading#data_sources—a list of references to the widgets that serve as data sources for the movementdistance—the manually set distance for calculating speed whenevent_source_typeisa_to_bevent_source_type—can have the valuesmovement,a_to_b, ora_minus_bgeo_locations—a list of lists where each inner list is a pair of decimal numbers denoting a latitude and longitude. This property describes positions in the WGS 84 system that make up the movement's shape. The feature will be functional in a future FLOW version—no valid values are filled there yet.
movement_category_stats—a list of lists. The first list inmovement_category_statscorresponds to the first movement in themovementslist etc. Within each list there are objects that contain statistical information about trajectories of each category for the corresponding movement. Only categories with more than 0 occurrences are mentioned.number—the number of trajectories of the specified category and movement- The other properties are statistical data calculated from the associated set of trajectories: section speed and travel time. Each has a minimum, maximum, average, and a value that the top 85th percentile exceeds.
Example of response's data contents:
"data": {
    "data_validity": "ok",
    "evaluation_validity": "ok",
    "object_count": 0,
    "granularity": 300000,
    "movements": [
        {
            "cartogram_position": [
                4,
                6
            ],
            "color": "#c890df",
            "data_sources": [
                {
                    "analytics_id": 0,
                    "cube_id": 0,
                    "output_id": 10
                }
            ],
            "distance": 0,
            "event_source_type": "movement",
            "geo_locations": [],
            "name": "Arm 4->Arm 6"
        },
        {
            "cartogram_position": [
                4,
                8
            ],
            "color": "#c890df",
            "data_sources": [
                {
                    "analytics_id": 0,
                    "cube_id": 0,
                    "output_id": 9
                }
            ],
            "distance": 0,
            "event_source_type": "movement",
            "geo_locations": [],
            "name": "Arm 4->Arm 8"
        },
        {
            "cartogram_position": [
                6,
                4
            ],
            "color": "#60cfc8",
            "data_sources": [
                {
                    "analytics_id": 0,
                    "cube_id": 0,
                    "output_id": 8
                }
            ],
            "distance": 0,
            "event_source_type": "movement",
            "geo_locations": [],
            "name": "Arm 6->Arm 4"
        },
        {
            "cartogram_position": [
                6,
                8
            ],
            "color": "#60cfc8",
            "data_sources": [
                {
                    "analytics_id": 0,
                    "cube_id": 0,
                    "output_id": 7
                }
            ],
            "distance": 0,
            "event_source_type": "movement",
            "geo_locations": [],
            "name": "Arm 6->Arm 8"
        },
        {
            "cartogram_position": [
                8,
                4
            ],
            "color": "#d9aa4c",
            "data_sources": [
                {
                    "analytics_id": 0,
                    "cube_id": 0,
                    "output_id": 5
                }
            ],
            "distance": 0,
            "event_source_type": "movement",
            "geo_locations": [],
            "name": "Arm 8->Arm 4"
        },
        {
            "cartogram_position": [
                8,
                6
            ],
            "color": "#d9aa4c",
            "data_sources": [
                {
                    "analytics_id": 0,
                    "cube_id": 0,
                    "output_id": 6
                }
            ],
            "distance": 0,
            "event_source_type": "movement",
            "geo_locations": [],
            "name": "Arm 8->Arm 6"
        }
    ],
    "movement_category_stats": [
        [
            {
                "category": "car",
                "number": 6,
                "section_speed_85th": 15.015166568756104,
                "section_speed_avg": 9.595792543888093,
                "section_speed_max": 39.13043403625488,
                "section_speed_min": 1.2413793325424194,
                "travel_time_85th": 18.08,
                "travel_time_avg": 11.373333333333333,
                "travel_time_max": 29,
                "travel_time_min": 0.92
            }
        ],
        [],
        [
            {
                "category": "car",
                "number": 8,
                "section_speed_85th": 57.46898220062256,
                "section_speed_avg": 25.97820121049881,
                "section_speed_max": 64.2857162475586,
                "section_speed_min": 3.6734693527221682,
                "travel_time_85th": 16.54,
                "travel_time_avg": 8.15,
                "travel_time_max": 19.6,
                "travel_time_min": 1.12
            }
        ],
        [
            {
                "category": "car",
                "number": 3,
                "section_speed_85th": 6.899313383102417,
                "section_speed_avg": 5.680180263519287,
                "section_speed_max": 7.826086807250976,
                "section_speed_min": 4.477611923217774,
                "travel_time_85th": 7.9079999999999995,
                "travel_time_avg": 6.746666666666666,
                "travel_time_max": 8.04,
                "travel_time_min": 4.6
            },
            {
                "category": "pedestrian",
                "number": 4,
                "section_speed_85th": 4.363545759916305,
                "section_speed_avg": 3.85523402094841,
                "section_speed_max": 4.9999998092651365,
                "section_speed_min": 3.3333332777023315,
                "travel_time_85th": 10.566,
                "travel_time_avg": 9.58,
                "travel_time_max": 10.8,
                "travel_time_min": 7.2
            },
            {
                "category": "van",
                "number": 1,
                "section_speed_85th": 11.25,
                "section_speed_avg": 11.25,
                "section_speed_max": 11.25,
                "section_speed_min": 11.25,
                "travel_time_85th": 3.2,
                "travel_time_avg": 3.2,
                "travel_time_max": 3.2,
                "travel_time_min": 3.2
            }
        ],
        [
            {
                "category": "car",
                "number": 5,
                "section_speed_85th": 16.454959716796875,
                "section_speed_avg": 14.871164131164551,
                "section_speed_max": 18.421052742004395,
                "section_speed_min": 12.591186046600342,
                "travel_time_85th": 9.4748,
                "travel_time_avg": 8.609399999999999,
                "travel_time_max": 10.007,
                "travel_time_min": 6.84
            },
            {
                "category": "tram",
                "number": 1,
                "section_speed_85th": 13.17991590499878,
                "section_speed_avg": 13.17991590499878,
                "section_speed_max": 13.17991590499878,
                "section_speed_min": 13.17991590499878,
                "travel_time_85th": 9.56,
                "travel_time_avg": 9.56,
                "travel_time_max": 9.56,
                "travel_time_min": 9.56
            }
        ],
        [
            {
                "category": "pedestrian",
                "number": 2,
                "section_speed_85th": 12.59878643989563,
                "section_speed_avg": 11.74904022216797,
                "section_speed_max": 12.962963390350343,
                "section_speed_min": 10.535117053985596,
                "travel_time_85th": 11.624,
                "travel_time_avg": 10.84,
                "travel_time_max": 11.96,
                "travel_time_min": 9.72
            }
        ]
    ]
}
Traffic light
Reports the current state of a traffic light as a numeric code. The state is provided by the traffic light source configured for the analytic (AI traffic light detection on the FLOW NODE, or a connected traffic controller), and is sampled at every evaluation of the analytic.
Widgets of this type are created together with the traffic light configuration of the analytic; they cannot be placed manually from the widget palette in FLOW Insights.
JSON identifier: traffic_light
Operator attribute: traffic_light
History supported: Yes
Output heaviness: Light data
Additional request parameters: none
Response's data object contents:
value—an integer code of the traffic light state0—red1—green2—orange3—red+orange simultaneously-1—the traffic light is switched off-2—the state is undefined (the source is connected but currently reports no valid state)-3—the state is unknown (the state reported by the source is not recognized)
data_validity—okwhen the state of the configured traffic light was received in the current evaluation,invalidwhen it was not (for example when the traffic light source is unavailable). Whendata_validityisinvalid, the content ofvalueis not meaningful.object_count—not used by this widget type; it is always0.
Example response body:
{
    "id": 7,
    "name": "TL - main direction",
    "output_type": "widget",
    "output_value_type": "traffic_light",
    "operator_attribute": "traffic_light",
    "analytic_id": 0,
    "cube_id": 3,
    "data_start_timestamp": "1619531319855",
    "data_end_timestamp": "1619531319855",
    "data": {
        "data_validity": "ok",
        "evaluation_validity": "ok",
        "object_count": 0,
        "value": 1
    }
}
Measurement units guide
What units do different widgets and attributes give you?
| Widget type | Attribute | Unit |
|---|---|---|
| Value | Object count | Pure number (unitless) |
| Occupancy | [s] | |
| Statistical value | Duration of occurrence | [m/s] |
| Stationary duration | [m/s] | |
| Current speed, Section speed | [kpx/s] (kilopixels per second) if using non-georegistered footage and [m/s] for georegistered footage | |
| Acceleration | [kpx/s²] (kilopixels per second squared) if using non-georegistered footage and [m/s²] for georegistered footage | |
| Gap distance | [m] | |
| Gap time | [s] | |
| Table | Trajectory list | Table has a descriptive header. All time data is in [s] except Trajectory start and Trajectory ends which have the [datetime] format. Speed in [kpx/h] if not georegistered or [km/h] when georegistered. Positions and sizes are in normalized screen coordinates—values from 0.0 to 1.0 where 0.0 is in the upper left corner of the image. For more details, see the table sink description. |
| Distribution | Color | Pure number (unitless) |
| Category | Pure number (unitless) | |
| Heatmap | Speed | Heatmap has a set of 2 values for each pixel – sum_data value and a count_data value.sum_data is the sum of speeds recorded in a given pixel and uses [kpx/s] for non-georegistered footage and [m/s] for georegistered footagecount_data is the number of objects that passed through that pixel and is, therefore, a unitless value |
| Acceleration | Same as with speed, but the units are [kpx/s²] and [m/s²]. | |
| Occupancy | sum_data is the number of objects that passed through the pixelcount_data is equal to 1 if at least one object has been detected there, otherwise, the value is 0Both of these values are unitless. | |
| Traffic light | Traffic light | Pure number (unitless) |
Need more help or have some questions?[Contact us!][contact]
Updated 6 days ago