Using webhooks to push traffic data to your HTTP server
Send widget output to your server when its values change.
So far, if you wanted traffic data, you either had to repeatedly request it from widgets or REST sinks, or register a UDP sink with fairly limited output formats. With webhooks, your options are more flexible. You can just select an existing widget, enter a URL, and all of this widget's value changes or time block changes will be sent to this URL. Sounds good? Let's dive into the details.
Setting up a webhook
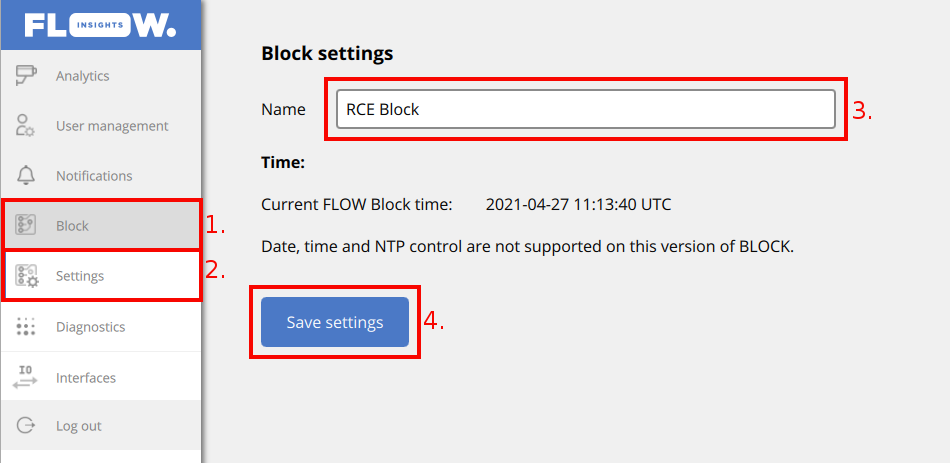
Webhooks can be created in FLOW Insights. First, you need to create a widget. Then, assign a descriptive name to your block. This name will be included in the widget output later.

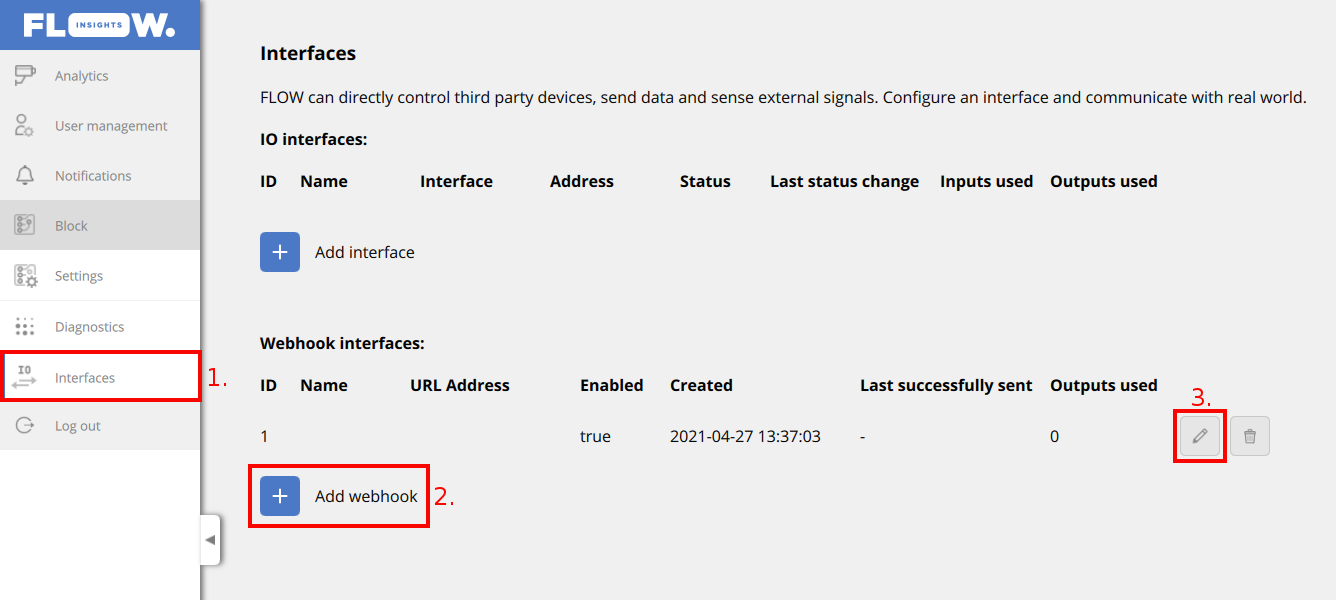
Go to Interfaces and select Add webhook. Then edit the new webhook.

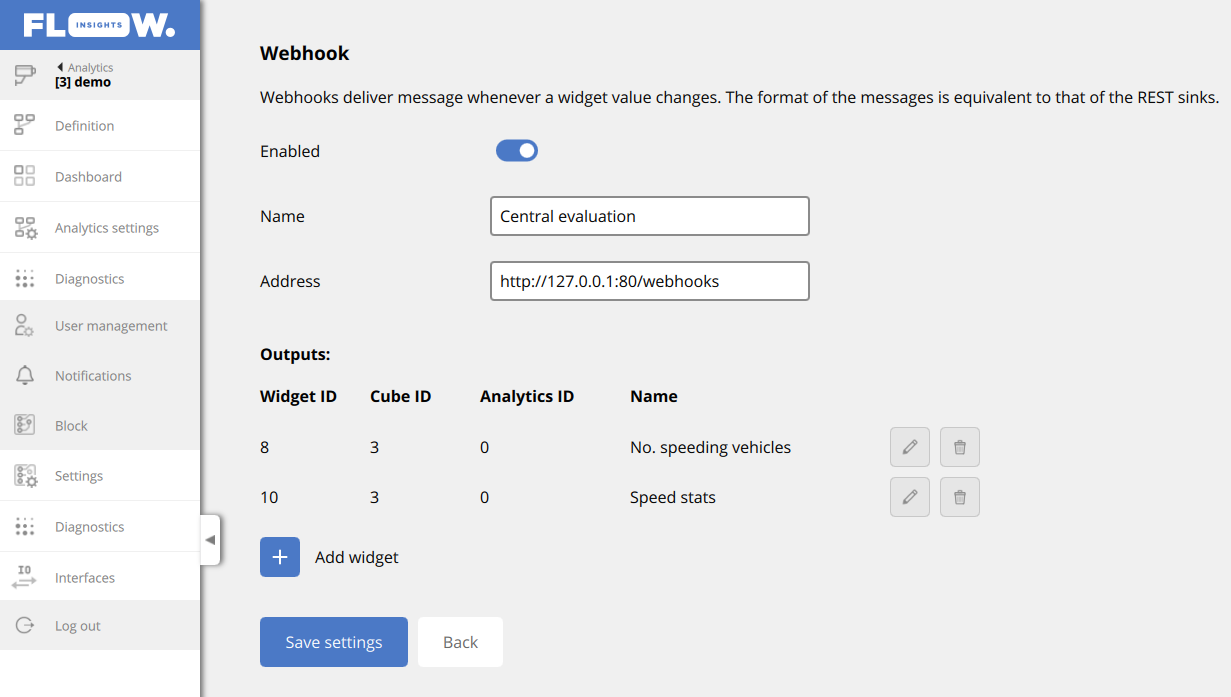
In the webhook editor, you can set the name and URL, which must have the prefix http://, followed by an address and optionally a port and a URI. You can add existing widgets to this webhook. Currently, you can add only widget types which support snapshots (history)—refer to the article about widget types for details.

After you save your changes, the block will automatically send outputs of widgets whose value has changed to the specified URL. However, if a widget's time mode is set to time blocks, then the block will instead send a new output each time the widget transitions into a new time block, regardless of whether the value has changed.
Processing a webhook output
Webhook outputs have the format of a HTTP POST message with the following headers:
Host: 127.0.0.1:80
Content-Type: application/json
Content-Length: 566
Connection: Keep-Alive
Accept-Encoding: gzip, deflate
Accept-Language: en-GB,*
User-Agent: Mozilla/5.0
The message body is the same as when requesting widget data, with an additional block_name property containing the name set up earlier.
{
  "block_name": "RCE Block",
  "cube_id": 3,
  "analytic_id": 0,
  "id": 8,
  "name": "No. speeding vehicles",
  "output_type": "widget",
  "output_value_type": "value",
  "operator_attribute": "object_count",
  "data_end_timestamp": "1619531319855",
  "data_start_timestamp": "1619530266644",
  "data": {
    "data_validity": "ok",
    "object_count": 91,
    "value": 2
  }
}
Responding to a webhook output
The block expects the receiver to respond to each POST message with a 200 (OK) HTTP status code. If a TCP connection couldn't be established while sending the output, the block will attempt to do it again up to 2 times immediately after the failure. If a TCP connection has been established, but the receiver didn't respond properly, the block will resend the message every 10 seconds up to 2 times. Then the message is discarded. You can make sure the response has been received by the block by checking the "Last successfully sent" field in FLOW Insights' Interfaces page. The times are displayed in the local timezone.

Need more help or have some questions?Contact us!
Updated 12 months ago
